
If your church has a website, one question matters more than almost any other:
What happens after someone visits your website?
Do they read your blog?
Do they click your Plan Your Visit page?
Do they watch a sermon?
Do they register for an event?
Or do they leave after just a few seconds?
Without the right tools, you'll never know.
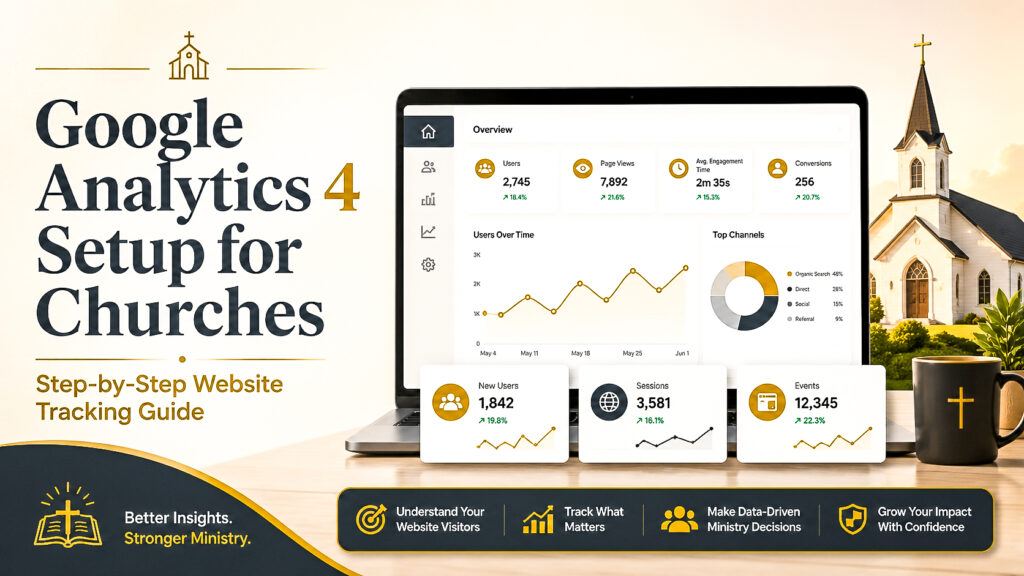
That's where Google Analytics 4 comes in.
Hold up a minute! Many churches spend countless hours building a website, writing blog articles, and promoting events online, but they rarely measure whether those efforts are actually helping people connect with their ministry.
Google Analytics 4, often called GA4, gives churches valuable insights into how people interact with their website. Instead of making decisions based on assumptions, you can use real data to better understand your visitors and improve their online experience.
Before we go any further, watch this free lesson to understand why SEO matters for every church website.
What Is Google Analytics 4?
Google Analytics 4 is Google's free website analytics platform. It helps you understand what visitors do after they arrive on your church's website.
Unlike Google Search Console, which shows how people found your website through Google Search, Google Analytics focuses on what people do once they get there.
Think of it this way.
Imagine your church building has a welcome team standing at the front door.
Google Search Console tells you how people found your church building.
Google Analytics tells you what they did after they walked through the front door.
Did they visit the children's ministry?
Did they stop by the information desk?
Did they head straight into the sanctuary?
Or did they walk in and leave almost immediately?
Your church website works the same way.
Google Analytics helps answer questions like:
- How many people visited your website?
- Which pages are the most popular?
- How long do visitors stay?
- What devices are they using?
- Which pages encourage visitors to keep exploring?
- Which pages cause people to leave?
These insights help you make better decisions about your website instead of relying on guesswork.
Google recently replaced Universal Analytics with Google Analytics 4 because it provides a more complete picture of how people interact with websites across multiple devices. Today, GA4 is the standard analytics platform for churches, businesses, and organizations around the world.
The goal isn't to become obsessed with numbers.
The goal is to better understand the people God is bringing to your website so you can serve them more effectively.
Why Should Churches Use Google Analytics 4?
Your church website is more than an online brochure.
It's often the first impression someone has of your ministry.
For many people, visiting your website is the first step before they ever attend a Sunday service. That's why understanding how people interact with your website is so valuable.
Google Analytics 4 helps churches move from guessing to understanding.
Instead of wondering whether your website is working, you can see how visitors are actually using it.
Here are some practical ways churches can benefit from Google Analytics 4.
Understand What Visitors Are Looking For
Not every visitor arrives with the same goal.
Some are looking for your service times.
Others want to learn about your children's ministry.
Some may be searching for a recovery program, a Bible study, or a place to belong.
Google Analytics helps you discover which pages receive the most attention so you can better serve the needs of your community.
Measure the Effectiveness of Your Digital Outreach
If you're investing time into blog articles, YouTube videos, social media, or email newsletters, you'll naturally want to know whether those efforts are bringing people to your website.
Google Analytics shows where your visitors come from, including:
- Google Search
- Social media
- Email campaigns
- Direct visits
- Referral websites
This helps you identify which outreach efforts are producing the greatest impact.
Improve Your Church Website
Every website has opportunities for improvement.
Google Analytics can help you answer questions like:
- Which pages keep visitors engaged?
- Which pages are causing visitors to leave?
- Which blog articles receive the most attention?
- Which ministry pages are rarely visited?
These insights can help you improve your navigation, strengthen your content, and create a better experience for first-time visitors.
Make Better Ministry Decisions
Hold up a minute! Analytics aren't just about numbers.
They're about people.
Behind every page view is someone searching for hope, encouragement, community, or biblical truth.
When you understand how people are interacting with your website, you can make decisions that remove obstacles and make it easier for someone to connect with your church.
Google Analytics and Google Search Console Work Better Together
One of the biggest misconceptions is that Google Analytics and Google Search Console do the same job.
They don't.
Think of them as two pieces of the same puzzle.
Google Search Console tells you how people found your website through Google Search.
Google Analytics tells you what they did after they arrived.
When you use both tools together, you gain a much clearer picture of your church's online ministry.
If you're new to website analytics, I recommend reading our Church Website Analytics Tools guide first. It explains how Google Analytics, Google Search Console, Microsoft Clarity, and other tools work together to help churches understand and improve their online presence.
As you become more familiar with Google Analytics, you'll begin making decisions based on real data instead of assumptions, and that's one of the most valuable habits a church can develop.
How to Set Up Google Analytics 4 for Your Church
The good news is that setting up Google Analytics 4 is easier than many church leaders expect.
Once it's installed correctly, Google Analytics begins collecting valuable information about how people interact with your church website.
Let's walk through the process one step at a time.
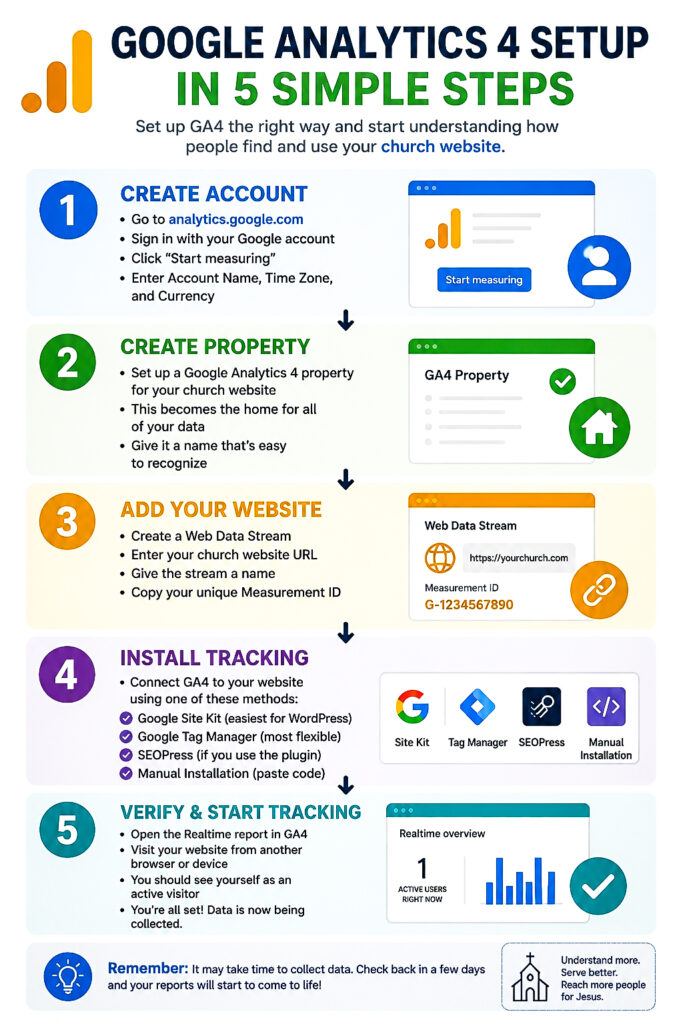
Step 1: Create a Google Analytics Account
If you don't already have one, visit the Google Analytics website and sign in using your Google account.
Click Start Measuring to create a new Analytics account.
You'll be asked to enter:
- Account Name (Your Church Name)
- Property Name (Usually your church website)
- Time Zone
- Currency
These settings help organize your reporting correctly from the very beginning.
Step 2: Create a Google Analytics 4 Property
Once your account is created, Google will automatically guide you through creating a GA4 property.
This property becomes the home for all of your website's analytics data.
Think of it as creating a digital filing cabinet where every website visit is recorded and organized.
Step 3: Add Your Website
Next, you'll create a Web Data Stream.
You'll enter:
- Your church website URL
- A stream name (such as “Church Website”)
Google will then generate a unique Measurement ID that connects your website to Google Analytics.
This Measurement ID allows GA4 to begin tracking visitor activity.
Step 4: Install the Tracking Code
Now it's time to connect Google Analytics to your website.
There are several ways to do this.
Option 1: Google Site Kit
If your church uses WordPress, Google Site Kit is one of the easiest installation methods.
It connects Google Analytics, Google Search Console, and other Google services through a simple setup wizard.
For many churches, this is the quickest option.
Option 2: Google Tag Manager
Google Tag Manager is ideal for churches that want greater flexibility over tracking events and future marketing tools.
While it requires a little more setup, it makes adding additional tracking much easier later.
Option 3: SEOPress
If your church already uses SEOPress, you may be able to connect Google Analytics directly through the plugin without editing your website's code.
This is a clean and beginner-friendly solution for many churches.
Option 4: Manual Installation
Some websites allow you to manually paste the Google Analytics tracking code into the website header.
Although this method works, plugin-based integrations are usually easier to manage over time.
Step 5: Verify Everything Is Working
After installing Google Analytics, don't assume everything is working correctly.
Verify it.
Open the Realtime report inside Google Analytics.
Then visit your own church website using another browser or your mobile phone.
Within a few moments, you should see yourself appear as an active visitor.
If you do, congratulations!
Google Analytics is now collecting data from your church website.
It is ok, If the Reports Look Empty
One question pastors often ask is:
“Why don't I see much data yet?”
That's completely normal.
Google Analytics needs time to collect information.
As people visit your website over the coming days and weeks, your reports will begin filling with meaningful data that helps you understand how visitors interact with your ministry online.
Remember, the goal isn't simply installing Google Analytics.
The goal is building a habit of reviewing your website's performance consistently so you can make better ministry decisions over time.
Understanding the Google Analytics 4 Dashboard
Once Google Analytics 4 is installed and collecting data, you'll be greeted with a dashboard filled with charts, reports, and numbers.
At first glance, it can feel overwhelming.
The good news is that you don't need to understand every report to start making better ministry decisions.
Hold up a minute! Think of Google Analytics like the dashboard in your car.
Your vehicle displays dozens of indicators, but most of the time you're only watching a few important ones, like your speed, fuel level, and engine temperature.
Google Analytics works the same way.
You don't need to study every report. You simply need to know where to find the information that helps your church better serve the people visiting your website.
Let's look at the reports you'll use most often.
Home Dashboard
The Home Dashboard gives you a quick snapshot of your website's overall performance.
Here you'll see:
- Total visitors
- Active users
- Recent traffic trends
- Top-performing pages
- Visitor activity over time
Think of this as your website's health check.
It's a great place to start every time you log in.
Realtime Report
The Realtime report shows what's happening on your website right now.
You can see:
- How many visitors are currently on your website
- Which pages they're viewing
- Where they're located
- What devices they're are using
This report is especially helpful after:
- Publishing a new blog article
- Sending an email newsletter
- Posting on social media
- Uploading a YouTube video
- Announcing an event
You can immediately see whether people are responding to your outreach.
Acquisition Report
One of my favorite reports is the Acquisition report.
This report answers one very important question:
Where are your visitors coming from?
You'll see traffic arriving from:
- Google Search
- Social media
- Direct visits
- Email campaigns
- Other websites
This helps you understand which outreach efforts are bringing people to your church website.
For example, if Google Search consistently sends the most visitors, you may decide to invest more time in blogging and SEO.
If YouTube begins driving more traffic, you'll know your videos are connecting with your audience.
Engagement Report
The Engagement report helps you understand what visitors do after arriving on your website.
It can show you:
- Which pages people spend the most time reading
- Which pages receive the most views
- How engaged visitors are with your content
- Which pages encourage people to continue exploring your website
These insights can help you improve existing pages instead of constantly creating new ones.
Sometimes your biggest opportunity isn't writing another article.
It's improving the one that's already helping people.
Pages and Screens Report
This report shows which pages are attracting the most visitors.
Pay close attention to:
- Blog articles
- Your Plan Your Visit page
- Ministry pages
- Sermon pages
- Event pages
If one page consistently receives more traffic than the others, ask yourself:
Why?
Google is often giving you clues about the type of content people are searching for.
Those clues can inspire future blog articles, sermon series, ministry resources, and outreach opportunities.
Don't Chase Every Number
One of the biggest mistakes churches make is trying to understand every statistic inside Google Analytics.
You don't need to.
Instead, focus on the reports that help you answer simple questions:
- Are more people finding our website?
- Which pages are helping visitors the most?
- Where is our traffic coming from?
- What content should we improve next?
When you keep your attention on these questions, Google Analytics becomes much less intimidating and much more practical.
Remember, the goal isn't becoming an analytics expert.
The goal is understanding the people God is bringing to your website so you can better serve them.
The 7 Google Analytics Metrics Every Church Should Watch
Google Analytics 4 tracks hundreds of different metrics.
The good news is that you don't need to monitor all of them.
Hold up a minute! Imagine walking into the cockpit of an airplane.
There are hundreds of buttons, switches, and gauges.
Fortunately, pilots don't stare at every instrument all at once. They focus on the ones that help them safely reach their destination.
Google Analytics works the same way.
Rather than trying to understand every report, start by watching these seven metrics.
1. Total Visitors
This tells you how many people visited your church website during a specific period.
Watching this number over time helps you answer an important question:
Is our online reach growing?
If your traffic continues to increase month after month, your website is likely becoming more visible and attracting more people.
2. Traffic Sources
Traffic Sources show you where visitors came from before arriving on your website.
Common sources include:
- Google Search
- YouTube
- Email newsletters
- Direct visits
This report helps you discover which outreach efforts are producing the greatest results.
Instead of guessing where to invest your time, you can make decisions based on real data.
3. Top Performing Pages
Not every page on your website receives the same attention.
Some pages naturally attract more visitors than others.
This report helps you identify:
- Popular blog articles
- Frequently visited ministry pages
- High-performing event pages
- Your most valuable resources
Once you know what's already working, you can improve those pages even further.
4. Engagement Time
Engagement Time measures how long visitors actively interact with your content.
Longer engagement often means your content is helpful and relevant.
If visitors leave after only a few seconds, it may be a sign that your page needs improvement.
Consider updating:
- Headlines
- Images
- Content structure
- Internal links
- Calls to action
Sometimes small improvements can significantly increase engagement.
5. New vs. Returning Visitors
This report tells you whether people are visiting your website for the first time or coming back again.
Both numbers are important.
New visitors suggest your church is reaching new people.
Returning visitors indicate that your content is valuable enough for people to come back.
Healthy church websites usually have a good balance of both.
6. Device Types
Google Analytics also shows which devices people are using.
For many churches, the majority of visitors now come from mobile phones.
If your website isn't mobile-friendly, you're likely creating unnecessary barriers for first-time guests.
Review your website on:
- Smartphones
- Tablets
- Desktop computers
Make sure every visitor has a great experience, regardless of the device they're using.
7. Conversions
Conversions are the actions you ultimately want visitors to take.
For churches, that might include:
- Planning a visit
- Completing a contact form
- Registering for an event
- Downloading a resource
- Joining your email list
- Requesting prayer
These actions often matter more than raw traffic numbers.
After all, the goal isn't simply getting people to your website.
The goal is helping them take the next step.
Focus on Progress, Not Perfection
Don't become discouraged if your numbers seem small in the beginning.
Every healthy church website starts somewhere.
Instead of comparing your website to larger ministries, compare your website to where it was last month.
Are more people finding your content?
Are visitors staying longer?
Are more people taking the next step?
Those are the trends worth celebrating.
Google Analytics isn't about chasing impressive statistics.
It's about understanding how your website is serving people and making thoughtful improvements over time.
When you consistently review these seven metrics, you'll begin making smarter decisions that strengthen both your website and your digital outreach ministry.
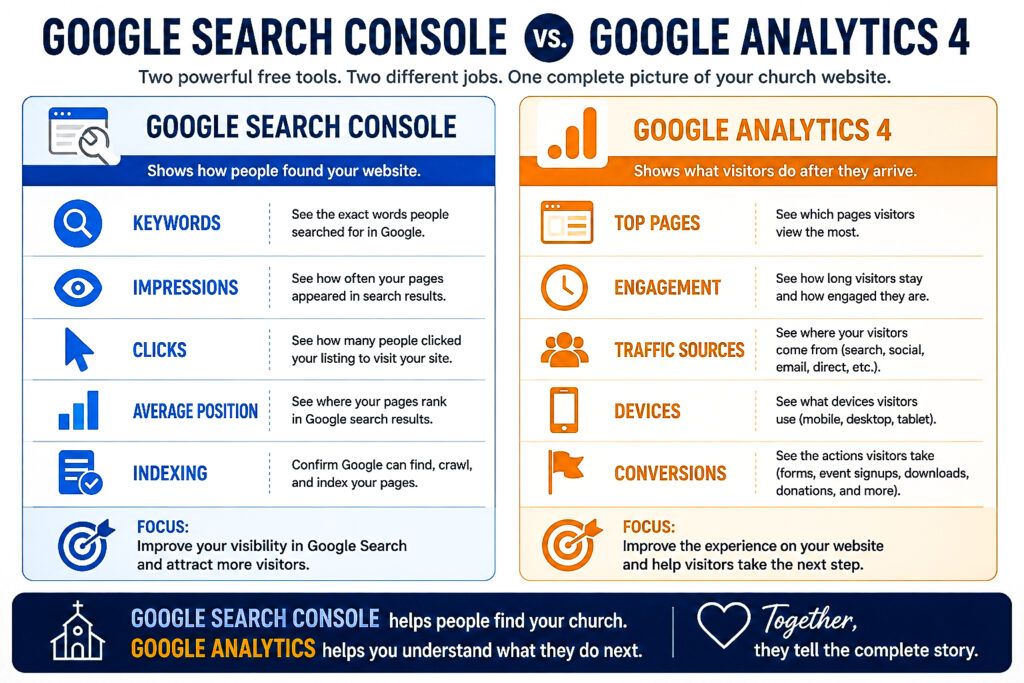
Google Analytics 4 vs. Google Search Console: What's the Difference?
One of the most common questions pastors ask is:
“Do I need both Google Analytics 4 and Google Search Console?”
The answer is yes.
While both tools help you understand your church website, they answer two completely different questions.
Hold up a minute! Think of your church website like a physical church building.
Google Search Console tells you how people found your church building.
Google Analytics tells you what they did after they walked through the front door.
Both perspectives are valuable.
Together, they give you a much clearer picture of your church's online ministry.
What Google Search Console Does
Google Search Console focuses on your visibility in Google Search.
It helps answer questions like:
- What keywords are people searching for?
- Which pages appear in Google Search?
- How many impressions are your pages receiving?
- How many people click your listings?
- What is your average position in search results?
- Is Google indexing your content correctly?
Search Console helps you understand how people discovered your website.
If you're new to Search Console, I recommend reading our Google Search Console for Churches guide. It explains how to use Google's free SEO tool to improve your church's online visibility.
What Google Analytics 4 Does
Google Analytics begins where Google Search Console ends.
Once visitors arrive on your website, Google Analytics helps answer questions like:
- Which pages did they visit?
- How long did they stay?
- Which pages kept them engaged?
- Did they register for an event?
- Did they fill out a contact form?
- Did they leave immediately?
Analytics helps you understand visitor behavior after they arrive.
Here's Why Both Tools Matter
Imagine you publish a new blog article.
Google Search Console tells you:
- The article received 1,200 impressions.
- 85 people clicked it.
- It ranks in position 6 for your target keyword.
That's incredibly valuable information.
But then Google Analytics tells you something equally important.
It shows:
- Visitors stayed on the page for nearly five minutes.
- Many continued reading additional articles.
- Several downloaded your free Church Google Visibility Scorecard.
- Others visited your Plan Your Visit page.
Now you're seeing the complete picture.
One tool explains how people arrived.
The other explains what they did once they got there.
My Favorite Website Growth Strategy
This is one of the strategies I use most often.
First, I open Google Search Console.
I'm looking for pages that are receiving a lot of impressions but very few clicks.
Those pages usually represent hidden opportunities.
Instead of writing another article, I improve the one Google is already testing.
I update the title.
I improve the featured image.
I strengthen the content.
I add internal links.
Then I monitor the results.
After visitors begin arriving, I open Google Analytics.
Now I can see whether those improvements are actually helping people stay longer, explore more pages, and take meaningful next steps.
One tool helps me attract visitors.
The other helps me serve them better.
Use Both Together
You don't have to become an analytics expert overnight.
Start by checking Google Search Console once a week to discover new opportunities.
Then use Google Analytics to understand how visitors interact with your website after they arrive.
Over time, these two free tools will help you make better decisions, improve your website, and create more opportunities for people to connect with your church online.
When used together, Google Analytics 4 and Google Search Console become one of the most powerful combinations available for churches wanting to grow their digital outreach.
Common Google Analytics 4 Mistakes Churches Make
Setting up Google Analytics 4 is a great first step.
Using it consistently is what makes the difference.
Here are some of the most common mistakes churches make after installing GA4.
1. Installing Google Analytics and Never Looking at It
Many churches install Google Analytics once and never sign in again.
Instead, schedule 15 to 20 minutes each week to review your website's performance.
Small, consistent improvements often lead to significant long-term growth.
2. Focusing Only on Traffic
More visitors are exciting, but traffic alone doesn't tell the whole story.
Ask yourself:
- Are visitors reading multiple pages?
- Are they spending time on your website?
- Are they planning a visit?
- Are they registering for events?
- Are they downloading resources?
Meaningful engagement is often more valuable than simply increasing visitor numbers.
3. Ignoring Mobile Visitors
For many churches, most website visitors come from smartphones.
If your website is difficult to navigate on a mobile device, you may unintentionally discourage first-time guests from exploring further.
Review your website regularly on both desktop and mobile devices to ensure a smooth experience for every visitor.
4. Never Connecting Google Search Console
One of the biggest opportunities churches miss is using Google Analytics and Google Search Console together.
Search Console helps you understand how people found your website.
Google Analytics helps you understand what they did after they arrived.
Together, they provide a much more complete picture of your church's online ministry.
5. Making Decisions Without Data
Sometimes churches redesign pages, remove content, or launch new initiatives based solely on assumptions.
Google Analytics gives you real information about what visitors are doing.
Let the data guide your decisions instead of relying on guesswork.
Frequently Asked Questions
Is Google Analytics 4 free?
Yes. Google Analytics 4 is completely free and available to any church with a website.
Do I need technical experience to use Google Analytics?
No.
While some reports are more advanced, most churches can benefit by learning just a few key reports, such as Realtime, Acquisition, Engagement, and Pages.
What's the difference between Google Analytics and Google Search Console?
Google Analytics shows what visitors do after arriving on your website.
Google Search Console shows how people found your website through Google Search.
Both tools complement one another and provide valuable insights.
How often should churches check Google Analytics?
For most churches, reviewing Google Analytics once a week is enough.
Regular check-ins help you identify trends without becoming distracted by daily fluctuations.
Can Google Analytics help my church grow?
Indirectly, yes.
Google Analytics won't increase your website traffic on its own.
What it does provide is the information you need to improve your website, strengthen your digital outreach, and better understand the people visiting your ministry online.
Final Thoughts
Your church website isn't just a collection of pages.
It's one of the most important digital front doors your ministry has.
Every visitor represents someone searching for hope, community, encouragement, or a church to call home.
Google Analytics 4 helps you understand how those visitors interact with your website so you can make thoughtful improvements that better serve them.
Remember, analytics isn't about becoming obsessed with numbers.
It's about removing barriers, improving the visitor experience, and helping more people take their next step toward your church.
If you're serious about growing your church's online presence, Google Analytics 4 is one of the most valuable free tools available.
Pair it with Google Search Console, continue creating helpful content, and review your data consistently.
Over time, you'll gain a much clearer picture of how your digital ministry is making an impact.
If you'd like to learn more about improving your church's visibility on Google, download the free Church Google Visibility Scorecard and explore the free lessons from the How Churches Get Found on Google course.
Every improvement you make today creates another opportunity for someone to discover your church tomorrow.